You are here

Amid Global Crises, Nuclear Power Provides Energy Security with Increased Electricity Generation in 2021

,

Nuclear power provided secure and reliable low-emission electricity amid evolving global crises in 2021, notching its second highest annual output of the last decade as the world emerged from the COVID-19 pandemic, according to annual data released by the IAEA Power Reactor Information System (PRIS).

The 2021 nuclear power operating statistics provided by IAEA Member States to PRIS—the Agency’s authoritative, comprehensive and publicly accessible database on nuclear power—also now feature in data from two recently released annual IAEA publications: Nuclear Power Reactors in the World (RDS-2) and Operating Experience with Nuclear Power Stations in Member States (OPEX).

The comprehensive data show nuclear power playing a key role in helping the world economy bounce back in 2021, providing a swift increase in electricity generation after its sharp fall during the pandemic lockdowns of 2020. Asia had the biggest increase, with nuclear power production rising 10% to the highest level in a decade.

As an energy crisis erupted in 2021 amid rising global demand after more than a year of pandemic, nuclear power demonstrated its enduring reliability, particularly in winter. Over the past five years, nuclear plants have scheduled refuelling and maintenance outages amid low demand during spring and autumn to ensure electricity provision in winter. PRIS outage data confirm that nuclear power’s energy availability factor (EAF) in Western and Eastern Europe has been consistently high, between 83% and 90%, since 2017. 

Nuclear power status and trends.   At the end of 2021, global operating nuclear power capacity was 389.5 GW(e), provided by 437 operational reactors in 32 countries. Nuclear power capacity has shown a gradual growth trend over the past decade, including 20.7 GW(e) in increased capacity from new units connected to the grid or upgrades to existing reactors.

In 2021, while the total global capacity decreased by some 3 GW(e) or 1% compared with 2020, electricity generation increased by 4%. During the year, 397.6 GW(e) of the total operational nuclear capacity from 447 nuclear power reactors was utilized to generate electricity and contributed to the 2021 statistics and analysis.

Throughout 2021, nuclear power reactors supplied 2653.1 TWh of low-emission, dispatchable electricity, slightly more than 2020 and accounting for about 10% of total global electricity generation and more than a quarter of the world’s low-carbon electricity generation. The Middle East and South Asia had the biggest increase, generating 20% more nuclear electricity than in 2020. For the second year in a row China produced more electricity than France, making China the second largest nuclear power producer after the United States. Nuclear electricity production in Eastern Europe was the highest in a decade, 6% more than in 2020 and about 15% over 2010 levels. Only North America saw a decrease, due to lower demand and retired capacity. Overall, nuclear electricity generation has shown steady growth over the past years, increasing more than 13% since 2012.

New build construction.   As of 31 December 2021, a total capacity of 58.1 GW(e) (56 reactors) was under construction in 19 countries. Installed nuclear power capacity under construction has remained largely steady in recent years, except for continuous growth in Asia, where a total of 63.6 GW(e) operational capacity (70 reactors) has been connected to the grid since 2005. In 2021, the construction of 5.6 GW(e) (six reactors) began in China at Changjiang-3 (1000 MW(e)), Changjiang-4 (1000 MW(e)), Linglong-1 (100 MW(e)), Sanaocun-2 (1117 MW(e)), Tianwan-7 (1171 MW(e)) and Xudabu-3 (1200 MW(e)). Two new PWR reactor projects, Kudankulam-5 and Kudankulam-6, each with 917 MW(e) capacity, began construction in India. In Europe, the Republic of Türkiye started construction of a third unit (1114 MW(e)) at the Akkuyu site, located on the Mediterranean coast. Russia began construction of a 300 MW(e), lead-cooled fast neutron reactor, Brest-OD-300.

Capacity added and units connected to the grid.   In 2021, 5.2 GW(e) of nuclear power capacity (6 new reactors) was connected to the grid, all of it in Asia, including 2.3 GW(e) (3 reactors) in China: 1000 MW(e) at Tianwan-6 (PWR), 1061 MW(e) at Hongyanhe-5 (PWR) and 200 MW(e) at Shidao Bay-1, a new generation modular high-temperature gas-cooled reactor. In India, the 630 MW(e) Kakrapar-3 (PHWR) was connected, followed by Pakistan’s 1017 MW(e) Kanupp-2 (PWR). Finally, in the United Arab Emirates, the 1310 MW(e) Barakah-2 (PWR) was connected to the grid.

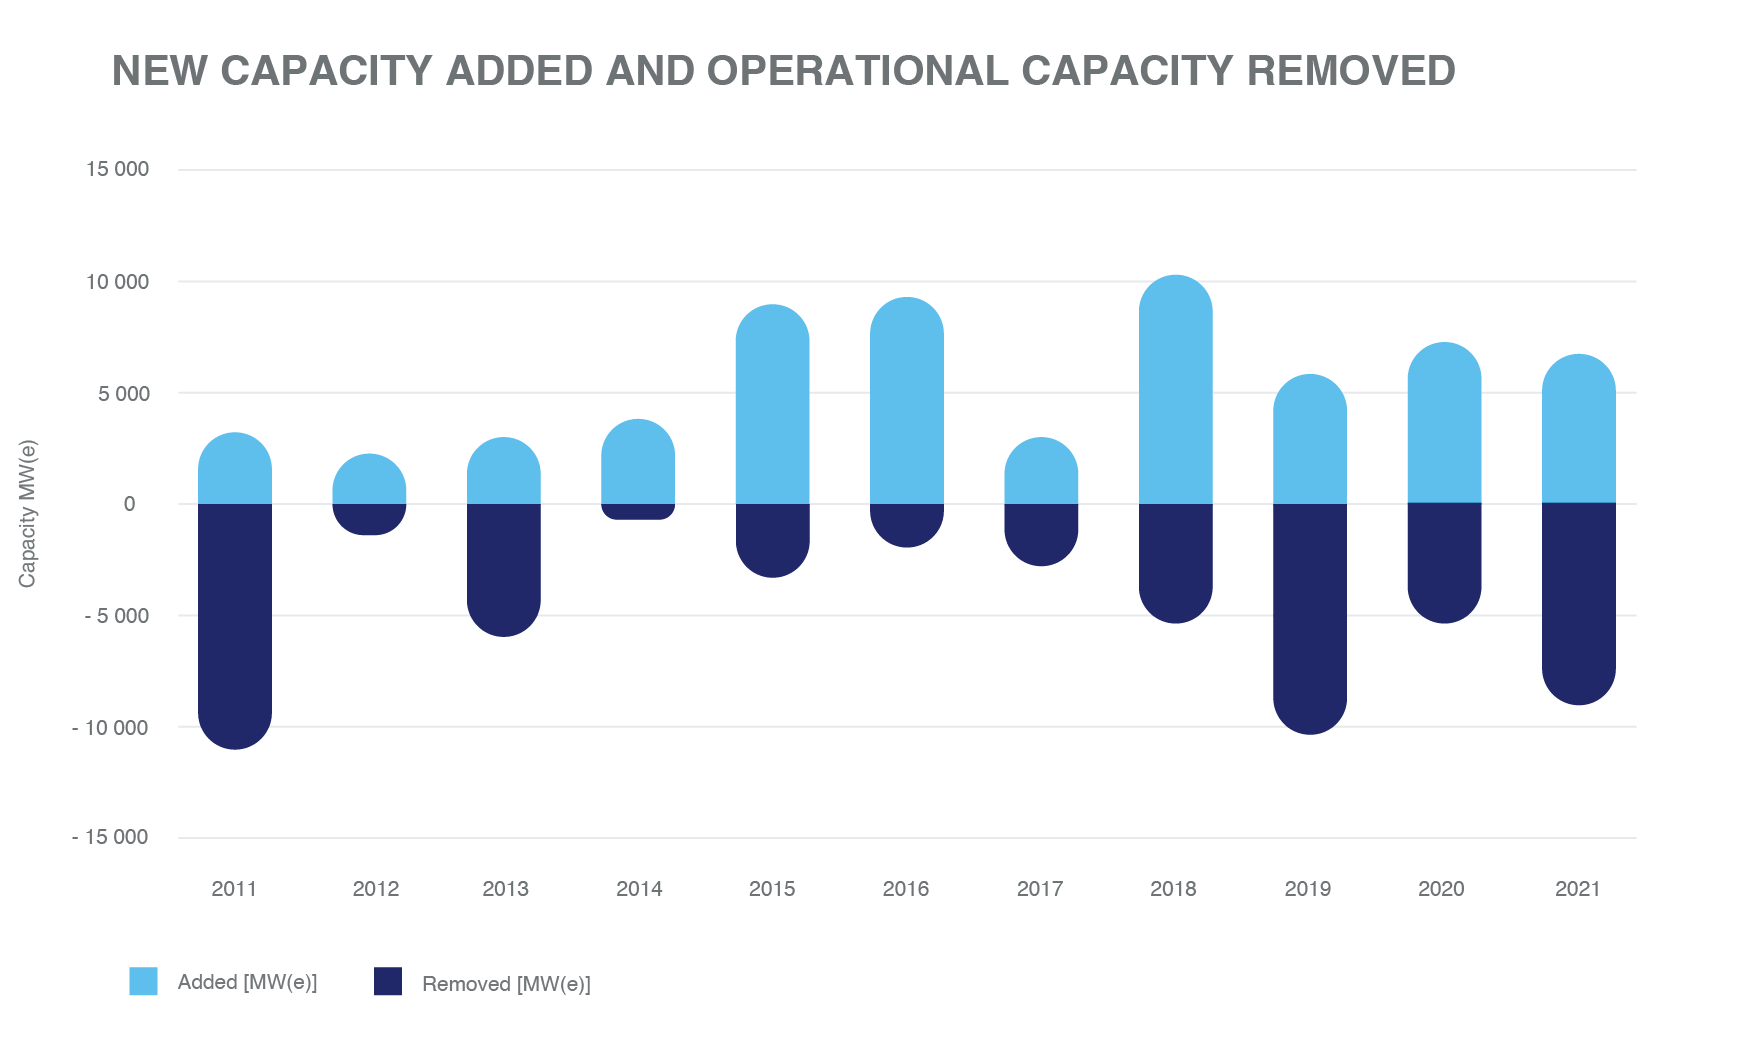
Capacity removed and permanent shutdowns.    During 2021, 8.7 GW(e) (10 reactors) of nuclear capacity was permanently shut down. Some 5.1 GW(e) of that capacity loss came from three reactors in Germany—Brokdorf (PWR, (1410 MW(e)), Grohnde (PWR, 1360 MW(e)), Gundremmingen-C (BWR, 1288 MW(e)) and three reactors in the United Kingdom: Dungeness Gas-Cooled Reactor (GCR) units B-1 and B-2 (each one 545 MW(e)) and Hunterston B-1 (GCR, 490 MW(e)). Pakistan’s first power reactor, Kanupp-1 (PHWR, 985 MW(e)), connected to grid over 50 years ago, was retired and after 45 years of operations, Kursk-1 (LWGR, 925 MW(e)) in Russia was shut down, followed by Kuosheng-1 (BWR, 985 MW(e)) in Taiwan, China.

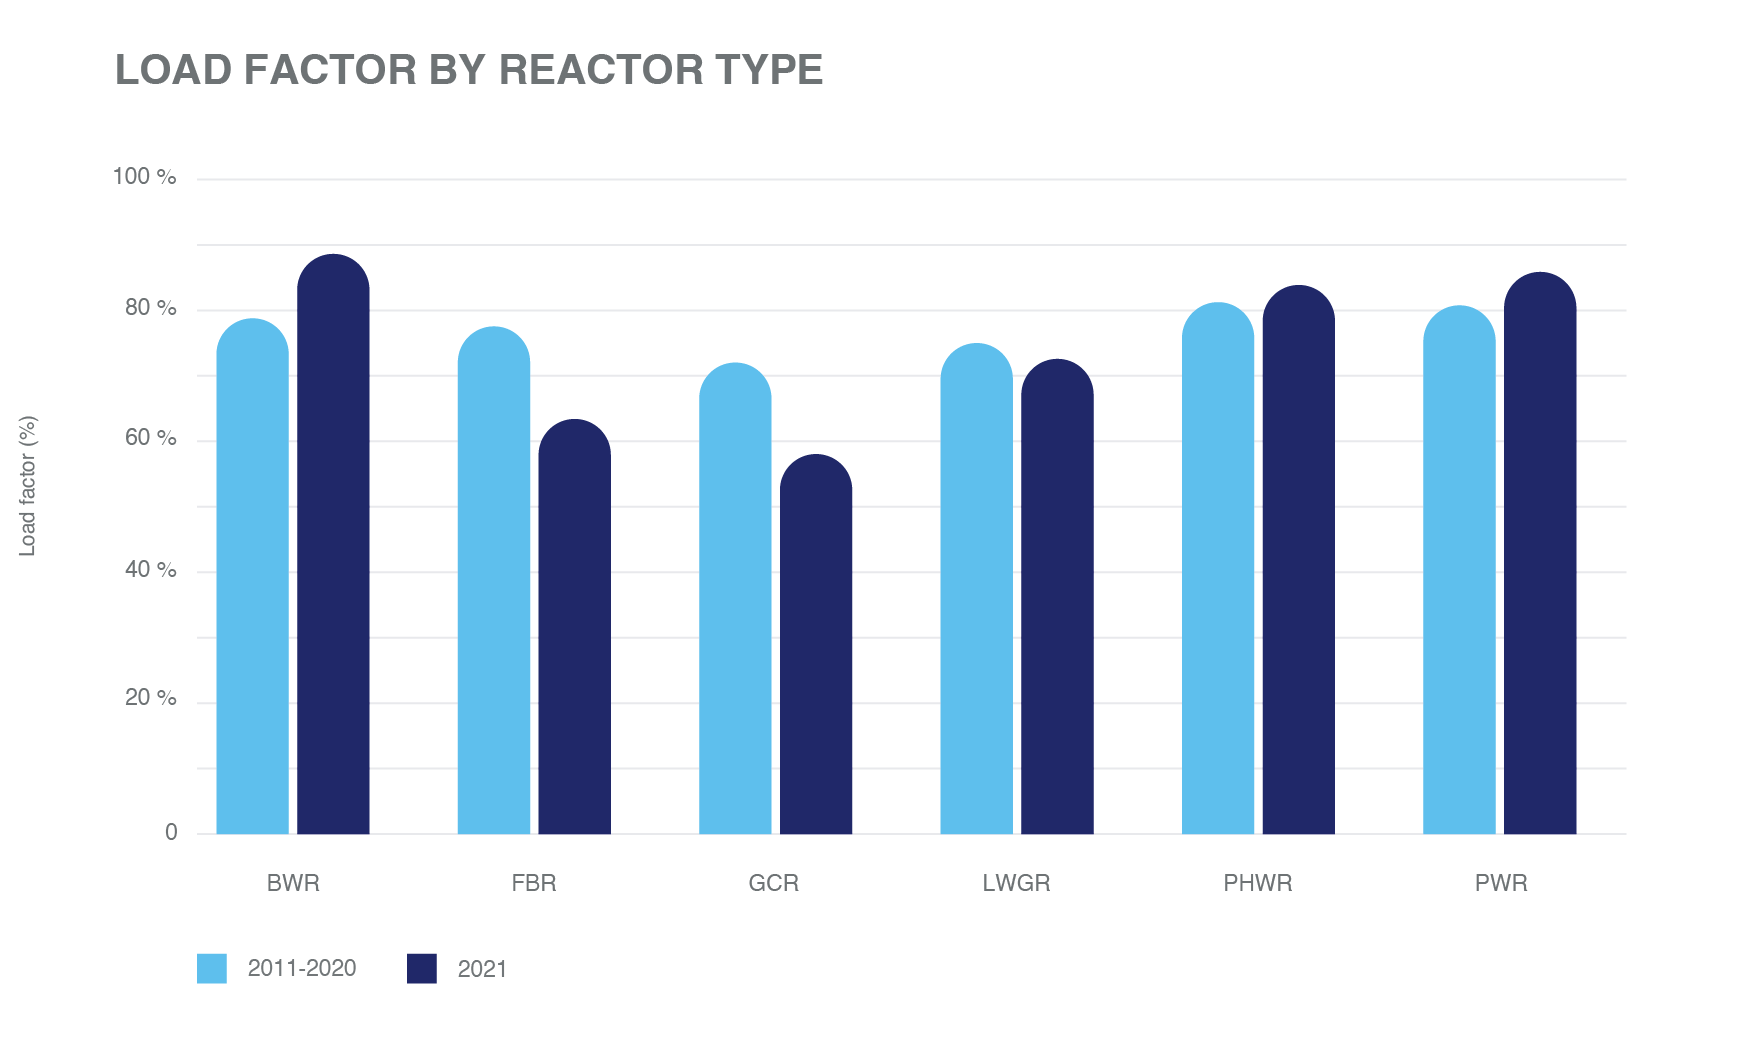
Operational reactor types.   At the end of 202189.9% of the operational nuclear power capacity was comprised of light water moderated and cooled reactor types; 6.2% were heavy water moderated and cooled reactor types; 1.9% were light water cooled and graphite moderated reactor types, 1.6% were gas cooled reactor types and 0.4% were liquid metal cooled fast reactors with a total capacity of 1.4 GW(e). During 2021 there was also the inclusion of Shidao Bay-1, China’s high-temperature reactor pebble-bed module that is part of a new generation of modular high-temperature gas-cooled reactors, with a total capacity of 200 MW(e).

Non-electric applications.   In 2021, 61 nuclear power reactors in 10 countries applied 2167.2 GWh of electrical equivalent of heat to support non-electric applications of nuclear energy. Over 89% of the non-electric applications were utilized in Europe, where 40.6 GW(e) of nuclear power capacity (54 reactors) generated 3007.4 GWh of electrical equivalent of heat to support district heating and process heating. The remaining 11% was produced by 4.5 GW(e) (7 reactors) in Asia to generate 249 GWh of electrical equivalent of heat to support desalination and process heating.

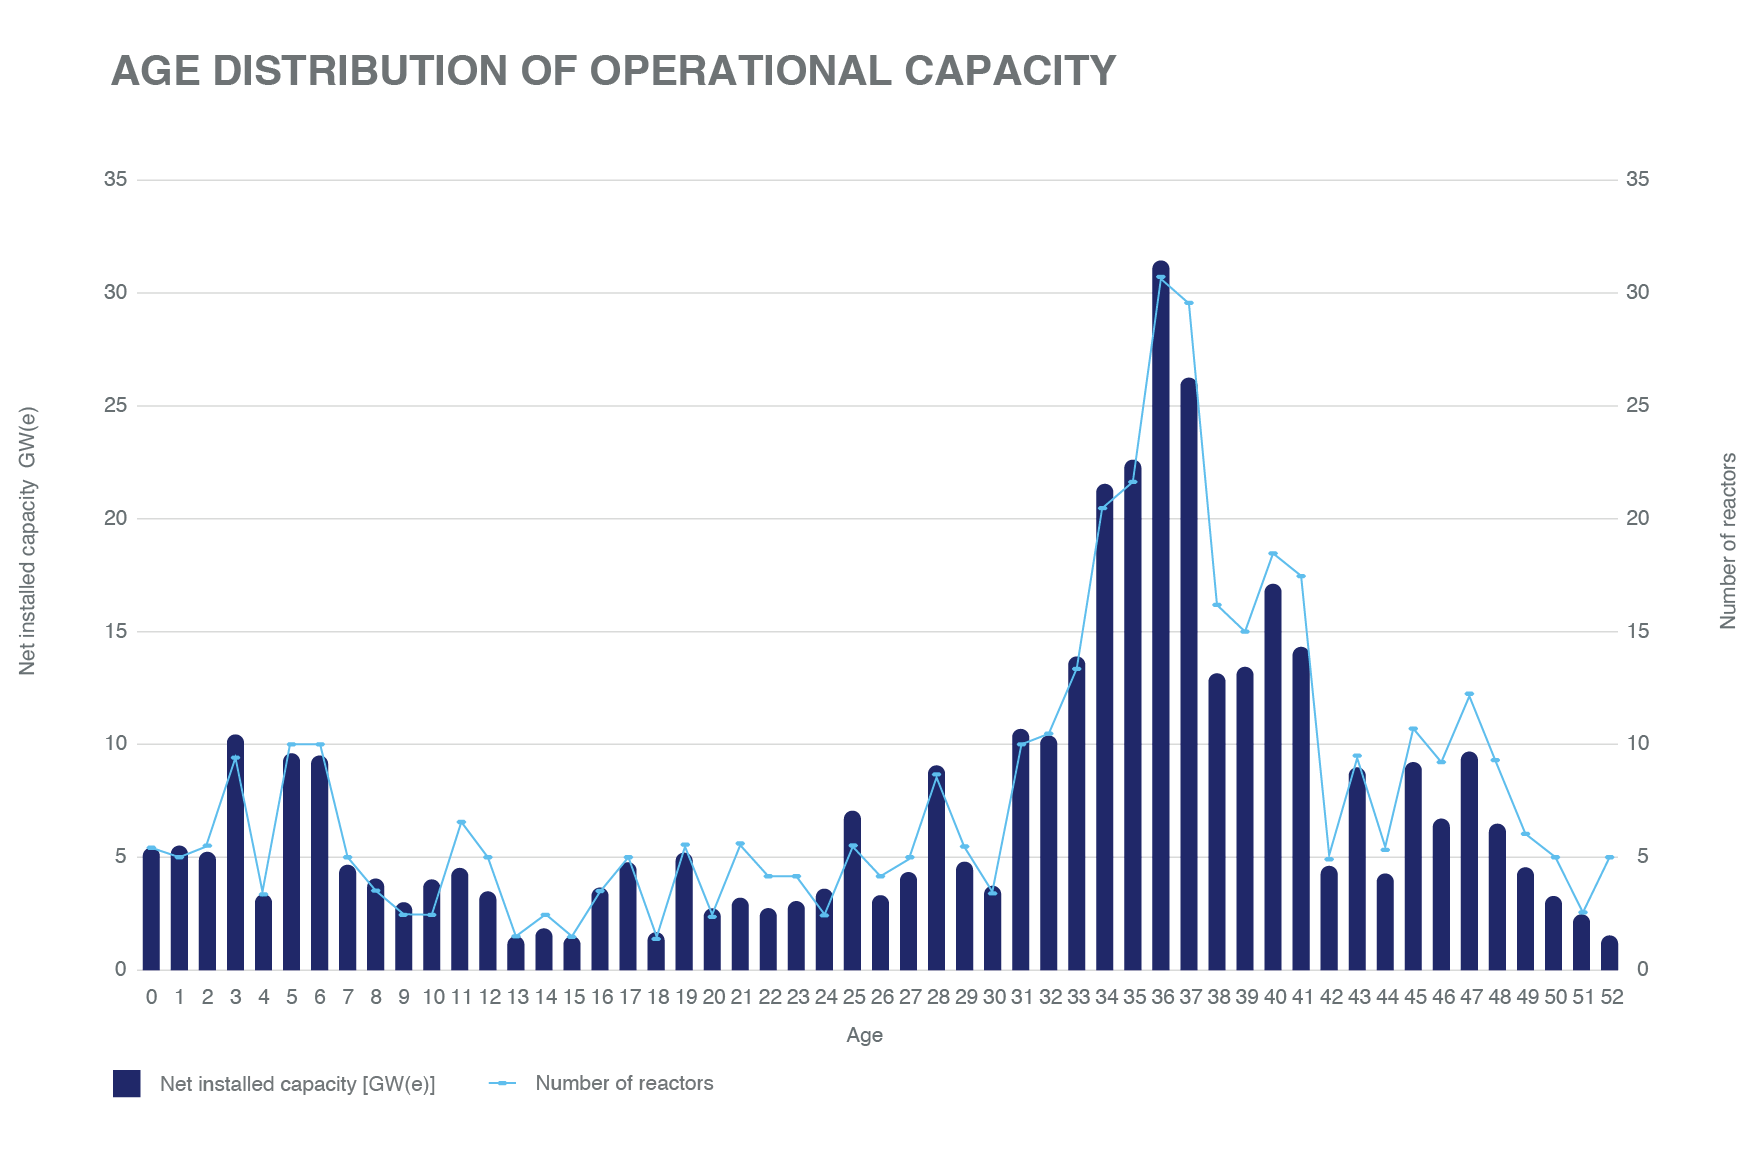
Operational lifetime.    At the end of 2021, the 67 years of worldwide cumulative operating experience amounted to over 19,170 reactor years, from 637 reactors with a total capacity of 485.4 GW(e) across 35 countries. Of this, 199 reactors with 95.8 GW(e) have been permanently shut down.

About 66% of total operational reactor capacity (257 GW(e), 289 reactors) has been in operation for over 30 years. Over 23% of global operating nuclear capacity (91.2 GW(e), 117 reactors) has been in service for over 40 years, while 1.9% of available capacity (7.3 GW(e), 13 reactors) been operated for over 50 years. The aging fleet highlights the need for new or uprated nuclear capacity to offset planned retirements and contribute to sustainability and global energy security and climate change objectives. Utilities, governments and other stakeholders are investing in long term operation and ageing management programmes for an increasing number of reactors to ensure sustainable operation and a smooth transition to new capacity.

Unit performance.    Even as the fleet ages, operational nuclear power reactors continue to demonstrate high levels of overall reliability and performance. Load factor, also referred to as capacity factor, is the actual energy output of a reactor divided by the energy output that would be produced if it operated at its rated power output (reference unit power) for the entire year. A load factor or capacity factor indicates good operational performance. In 2021, the global median capacity factor was 85.6%, in line with recent years. Pressurized water reactors (PWR) and pressurized heavy water moderated, and cooled reactors (PHWR) have been the best performing reactors since 2011, with median capacity factors of 82% and 81%, respectively.

Another indicator measuring the performance of nuclear reactors is the energy availability factor (EAF), which refers to the ratio of energy that the available capacity could have produced during a specific time period, compared to the energy that the reference unit power could have produced. In 2021, the weighted average EAF was 77.6%, where half of nuclear reactors also operated with an EAF above 86%. Plant operators typically schedule refuelling and maintenance outages during low demand seasons to maximize energy availability during high demand seasons.

PRIS statistics show that the average duration of full outages in 2021 were the shortest over the past decade, due to optimization of maintenance and inspections as well as improvement in operations management, safety culture and personnel policies.

Full planned outages averaged 24 days in 2021 compared to 51 days in 2020, and were mostly due to inspection, maintenance or repair combined with refuelling. The duration of unplanned outages due to causes under plant management control also decreased in 2021, an average of 4 days versus 8 days in 2020. The main causes of unplanned outages were reported as equipment problems or failures. Unplanned outages due to external reasons were mainly due to load-following control or reserve shutdown due to reduced energy demand and decreased to 4 average days in 2021, compared with 9 days in 2020. Flexible nuclear power plant operation supported grid operator needs and demonstrated nuclear power’s ability to integrate into sustainable energy systems of the future, which are expected to rely significantly on flexible baseload generation technologies.

The reliability and safety of nuclear power reactors remained at a high level, the data show. The graph below demonstrates a gradual reduction of unplanned scrams per 7000 hours (approximately one year) of operation per unit since 2011. The reduction in the number of unplanned scrams is attributed to a history of continuously improving plant operations and maintenance management.

For more nuclear power statistical data and related graphics, refer to the Agency’s PRIS database. PRIS has been developed and maintained by the IAEA since 1969, based on information from officially nominated counterparts in countries worldwide.

PRIS data are also used as the basis for two annual IAEA publications:

Additionally, The PRIS Nuclear Power Status poster  visually presents the status of nuclear power in the world. It summarizes status changes, regional statistics, operating experience, country statistics, among other key facts.

Notes:

  • Information and data received by the IAEA through 31 May 2022 are included in this story. Any modifications received at a later date are available in the PRIS database.

Stay in touch

Newsletter